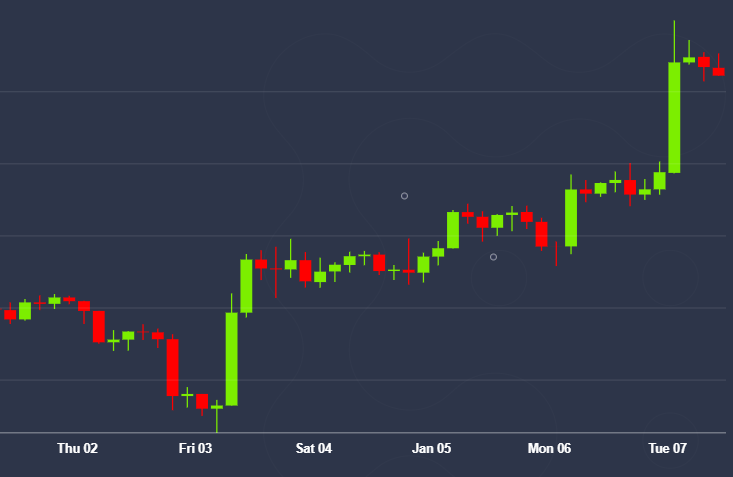
A long-term bitcoin price resistance has come into play for the first time in two months.
The widely-tracked 100-day moving average (MA), currently located at $7,945, was breached in the early Asian trading hours, according to Bitstamp data. The move, however, ran out of steam at $8,000 and prices soon fell back below the major hurdle.
At press time, bitcoin is changing hands at $7,870 on Bitstamp, representing a 14.8 percent gain from Friday’s low of $6,853. The global average price, as calculated by CoinDesk’s Bitcoin Price Index, currently stands at $7,860 – up 4.6 percent on a 24-hour basis.
The 100-day MA last came into play at the end of October. Back then, a UTC close above the average line had remained elusive for three straight days, starting from Oct. 26 to Oct. 28, as seen below.
The sharp rise from Oct. 26 lows near $7,400, which many linked to China’s President Xi’s encouraging comments on blockchain technology, ended with rejection above the 100-day average (marked by a circle).
Essentially, bitcoin charted a bearish lower high with the failure at the average hurdle and ended up falling to lows below $6,500 in December.
Hence, the 100-day MA at $7,945 is the level to watch out for in the next 24 hours. A UTC close higher will likely invite stronger buying.
Technical charts indicate the odds are stacked in favor of a
convincing move above the crucial average resistance.
Bitcoin jumped 5.52 percent on Monday, confirming an inverse head-and-shoulders breakout on the daily chart.
The bullish reversal pattern has opened the doors for a rise to $8,735 (target as per the measured move method).
The breakout is backed by ascending (bullish) 5- and 10-day averages. Further, the 14-day relative strength index is hovering at 63.51, the highest level since Oct. 27, indicating strengthening bullish bias.
The short-term bullish case would weaken if prices find acceptance under the former resistance-turned-support of the inverse head-and-shoulders neckline, currently at $7,586, although looks unlikely at press time.
The head-and-shoulders breakout on the daily chart has confirmed the seller exhaustion signaled by a hammer candle created in the seven days to Dec. 22 and last week’s doji candle.
A bullish breakout on the weekly chart would be confirmed only if and when the six-month falling channel is breached to the higher side. Currently, the channel resistance is located at $8,000.
Disclosure: The author does not currently hold any digital assets.
Disclosure Read More
The leader in blockchain news, CoinDesk is a media outlet that strives for the highest journalistic standards and abides by a strict set of editorial policies. CoinDesk is an independent operating subsidiary of Digital Currency Group, which invests in cryptocurrencies and blockchain startups.


